


Fisheries and Habitat Mapping
Environmental assessment and monitoring are critical to understanding our marine ecosystems. Identifying bottom cover and marine habitats however can be a challenging and time-consuming process with traditional equipment. Indicators such as reflectivity, depth variation and statistical local spatial distributions are used to characterize bottom cover and benthic productivity. Raw bathymetric data collected over a narrow swath however is not necessarily indicative of benthic flora, and correlating an acoustic signature with a benthic target of interest requires extensive sounding and ground truthing to be undertaken. This process of observation of ground-truthing precludes any large-scale mapping efforts by marine biologists, even in coastal environments.
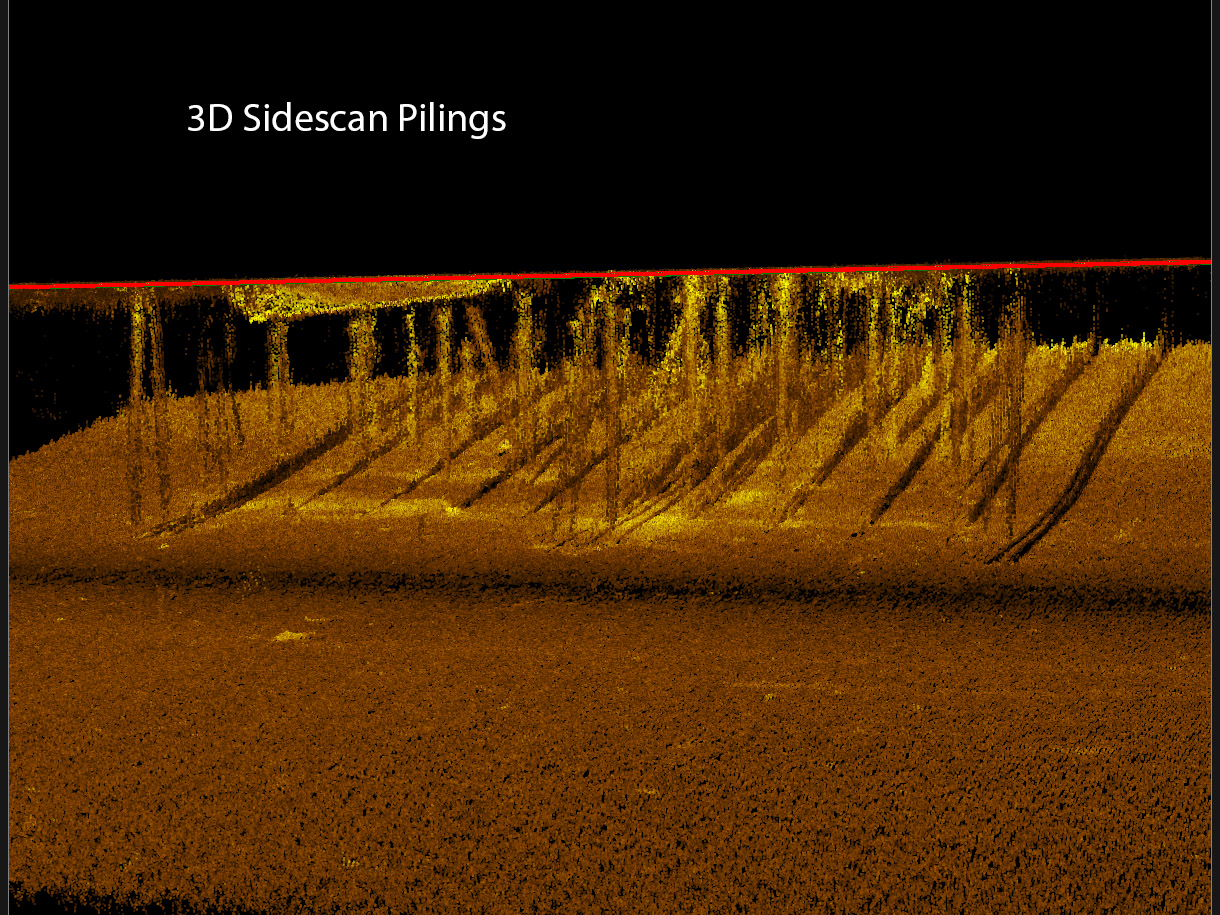
The navigated 3D point cloud data of the 3DSS allows for imaging of shallow water benthic habitats across ultra-wide swath. 3D representation allows for target characterizations based on acoustic reflectivity (backscatter intensity), target height with respect to surrounding bottom, and the spatial distribution of a target of interest. 3D imaging allows for rapid identification of bottom cover and ecosystem indicators while also providing water column imagery of targets of interest such as static fishing gear or traps. Especially in protected or endangered ecosystems, identifying and rectifying hazards to marine life provides marine flora and fauna the greatest chance of survival and success.
Habitat Mapping
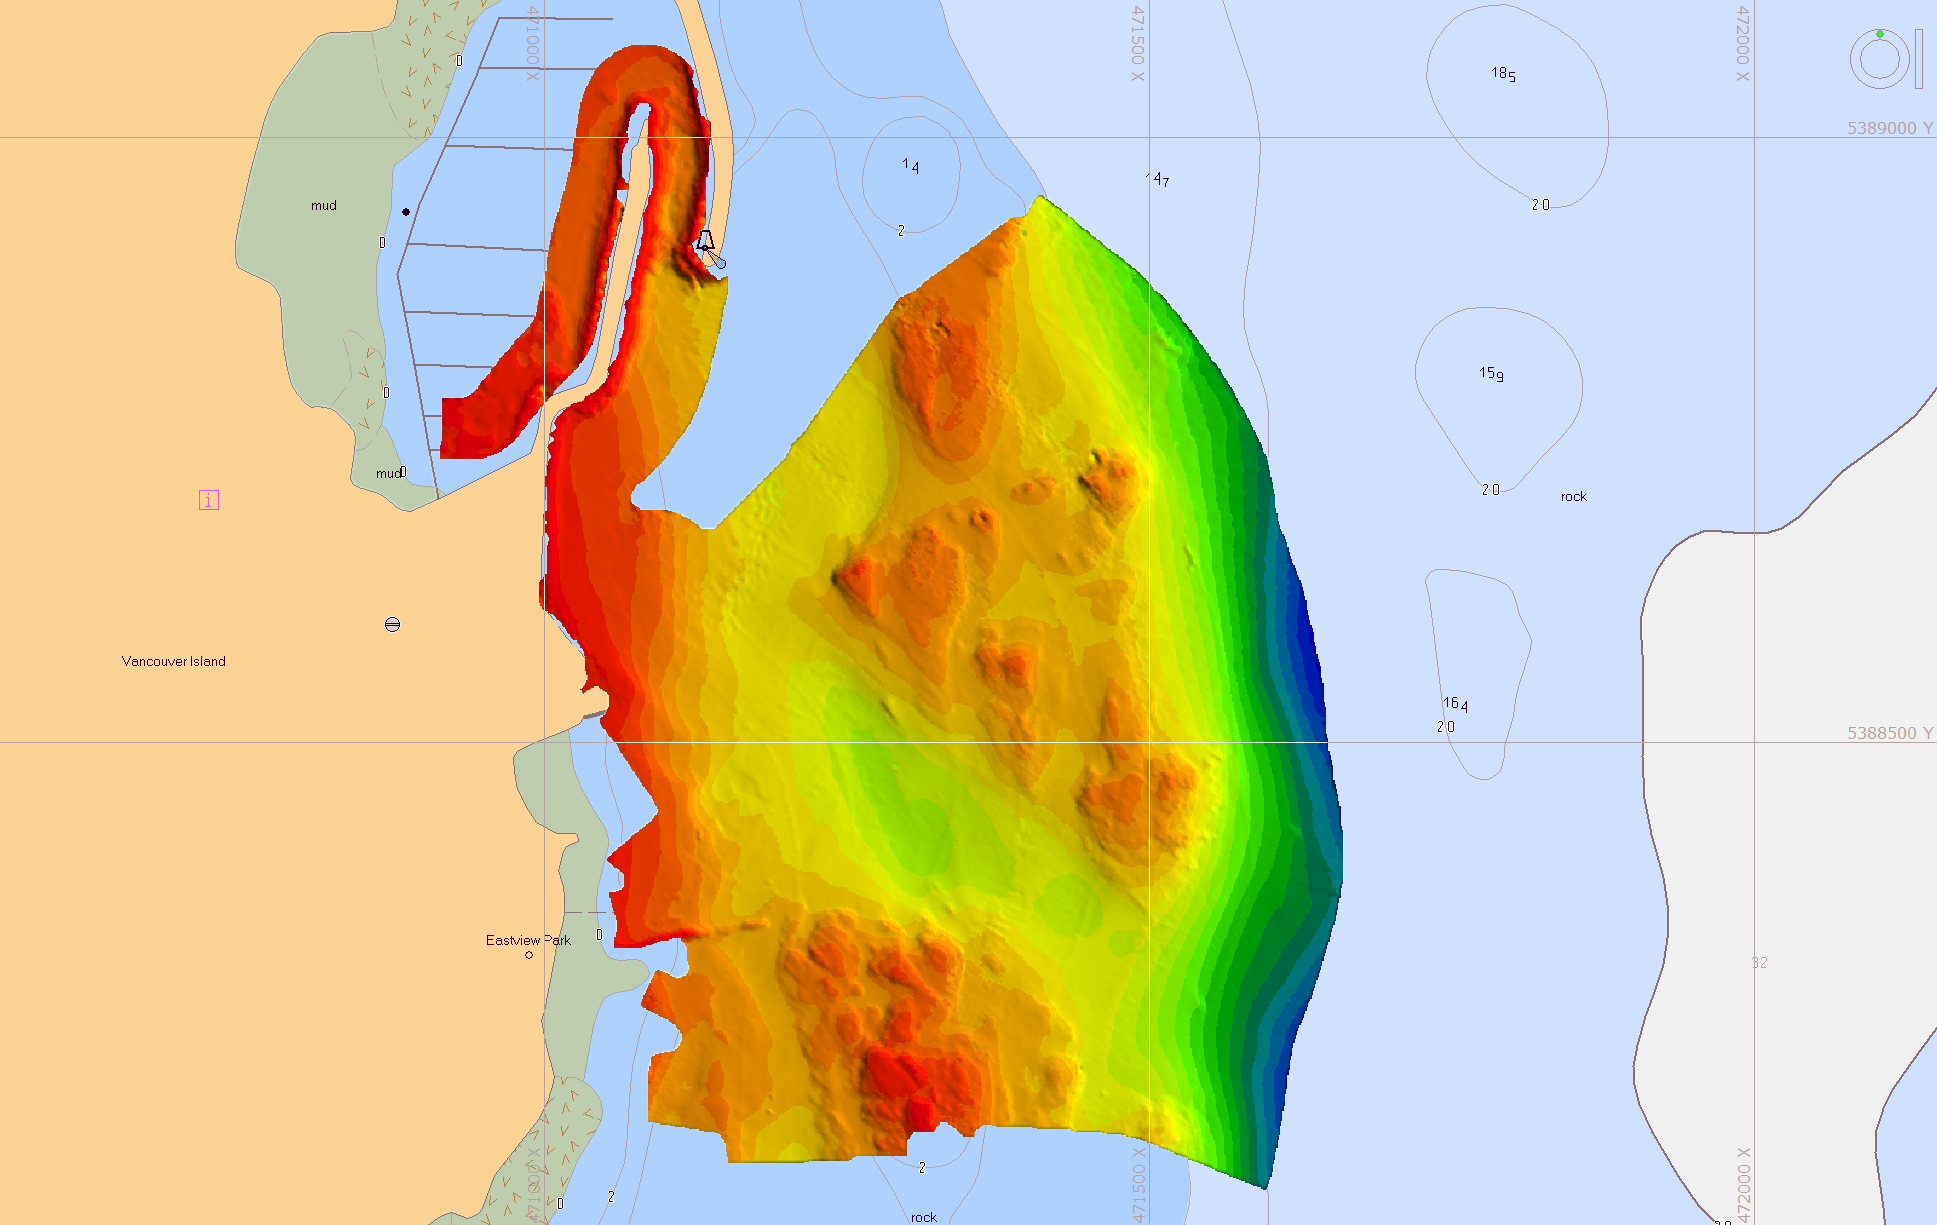
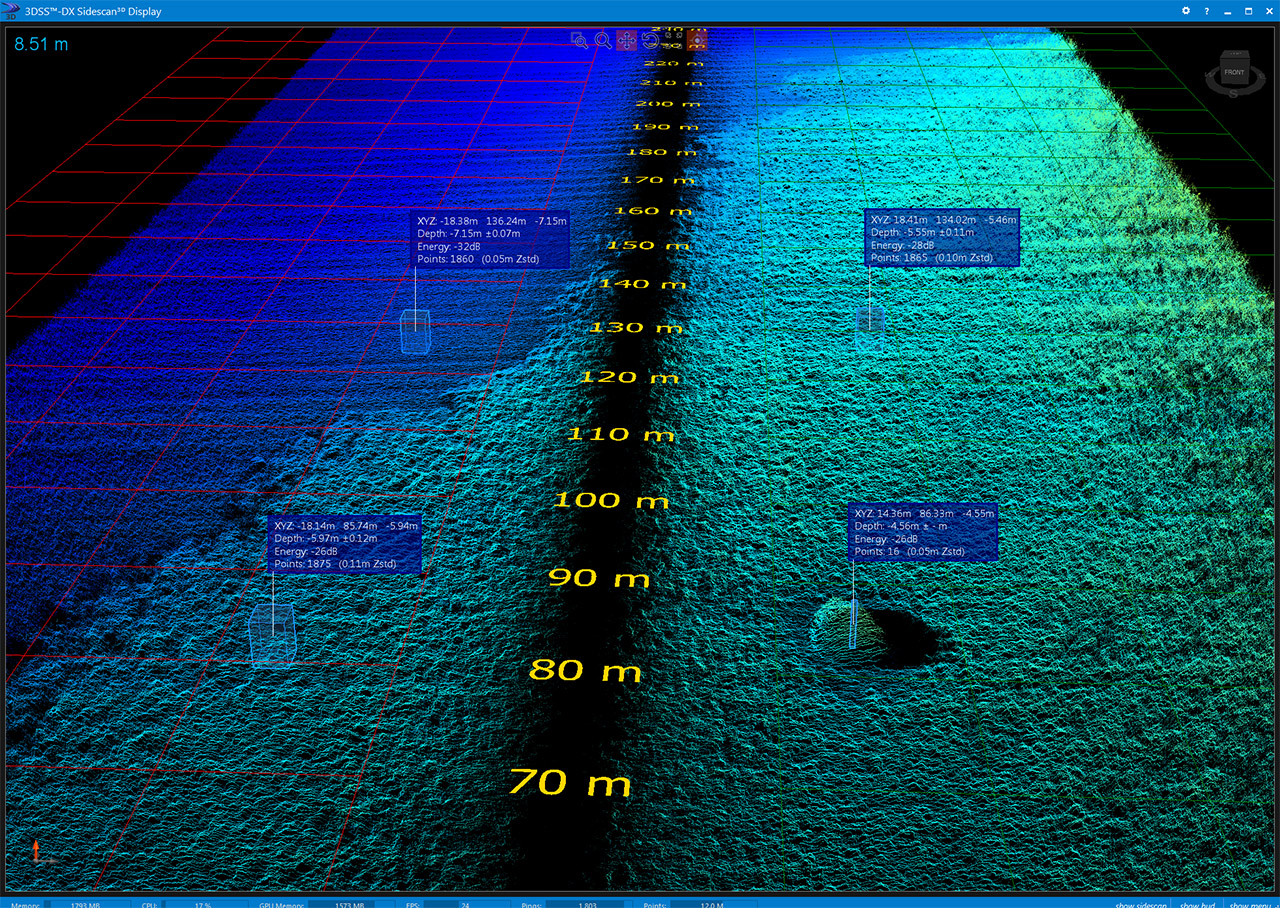
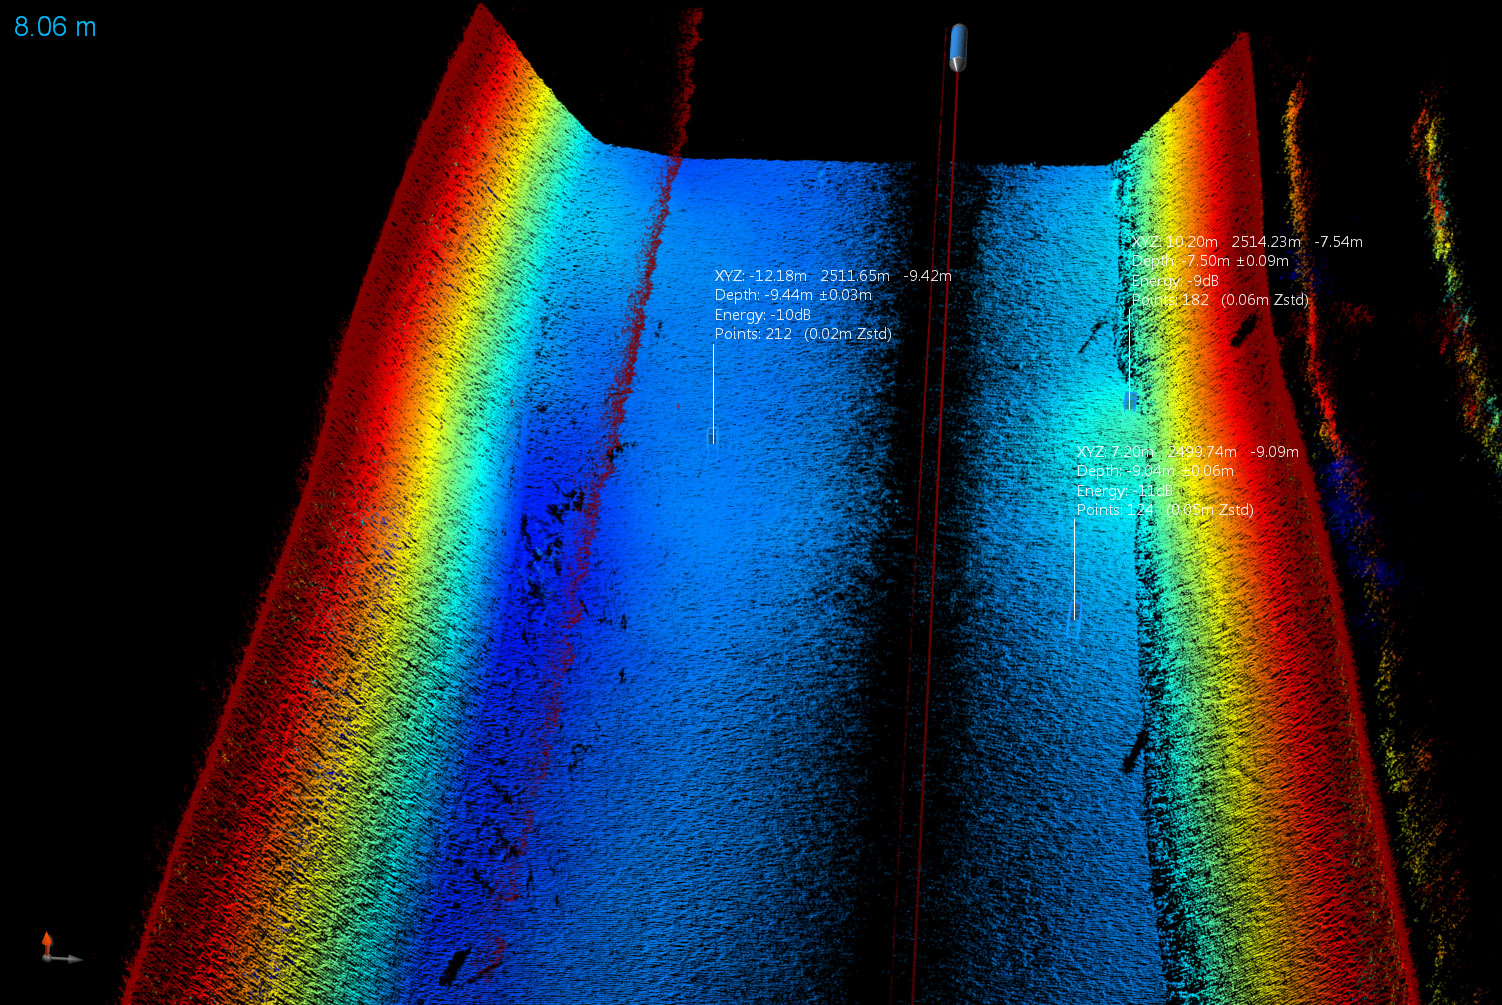
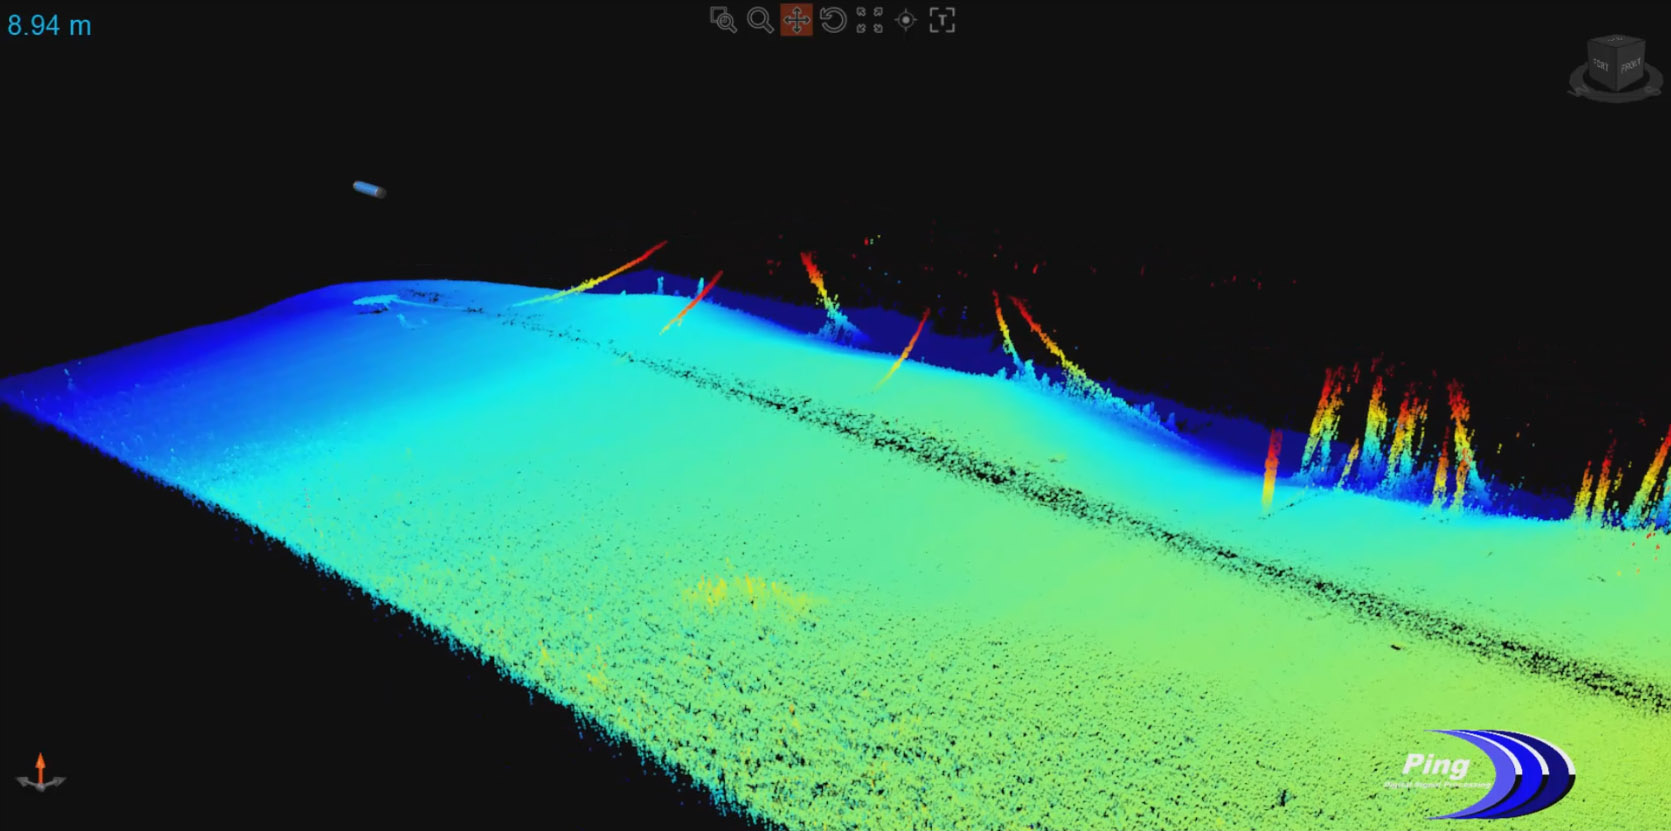
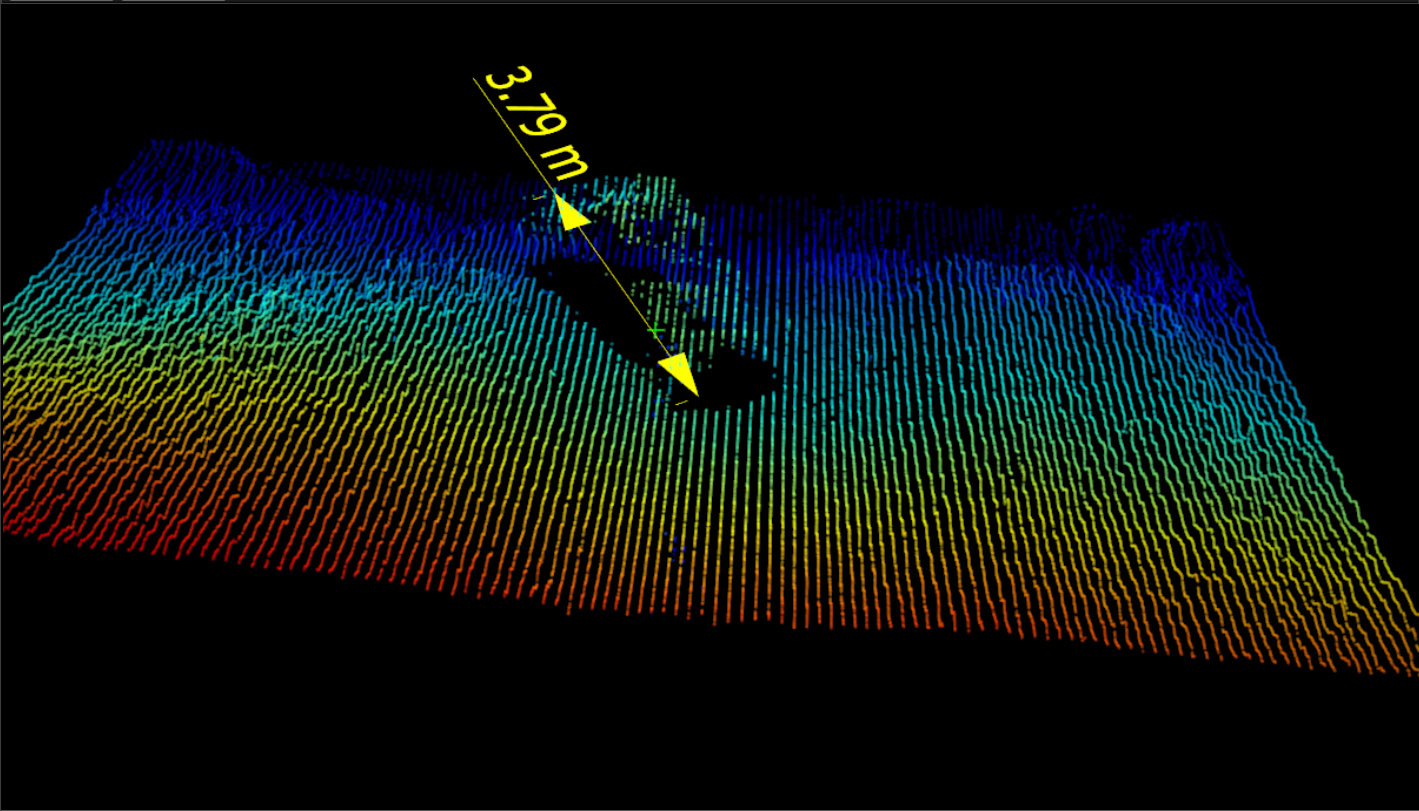
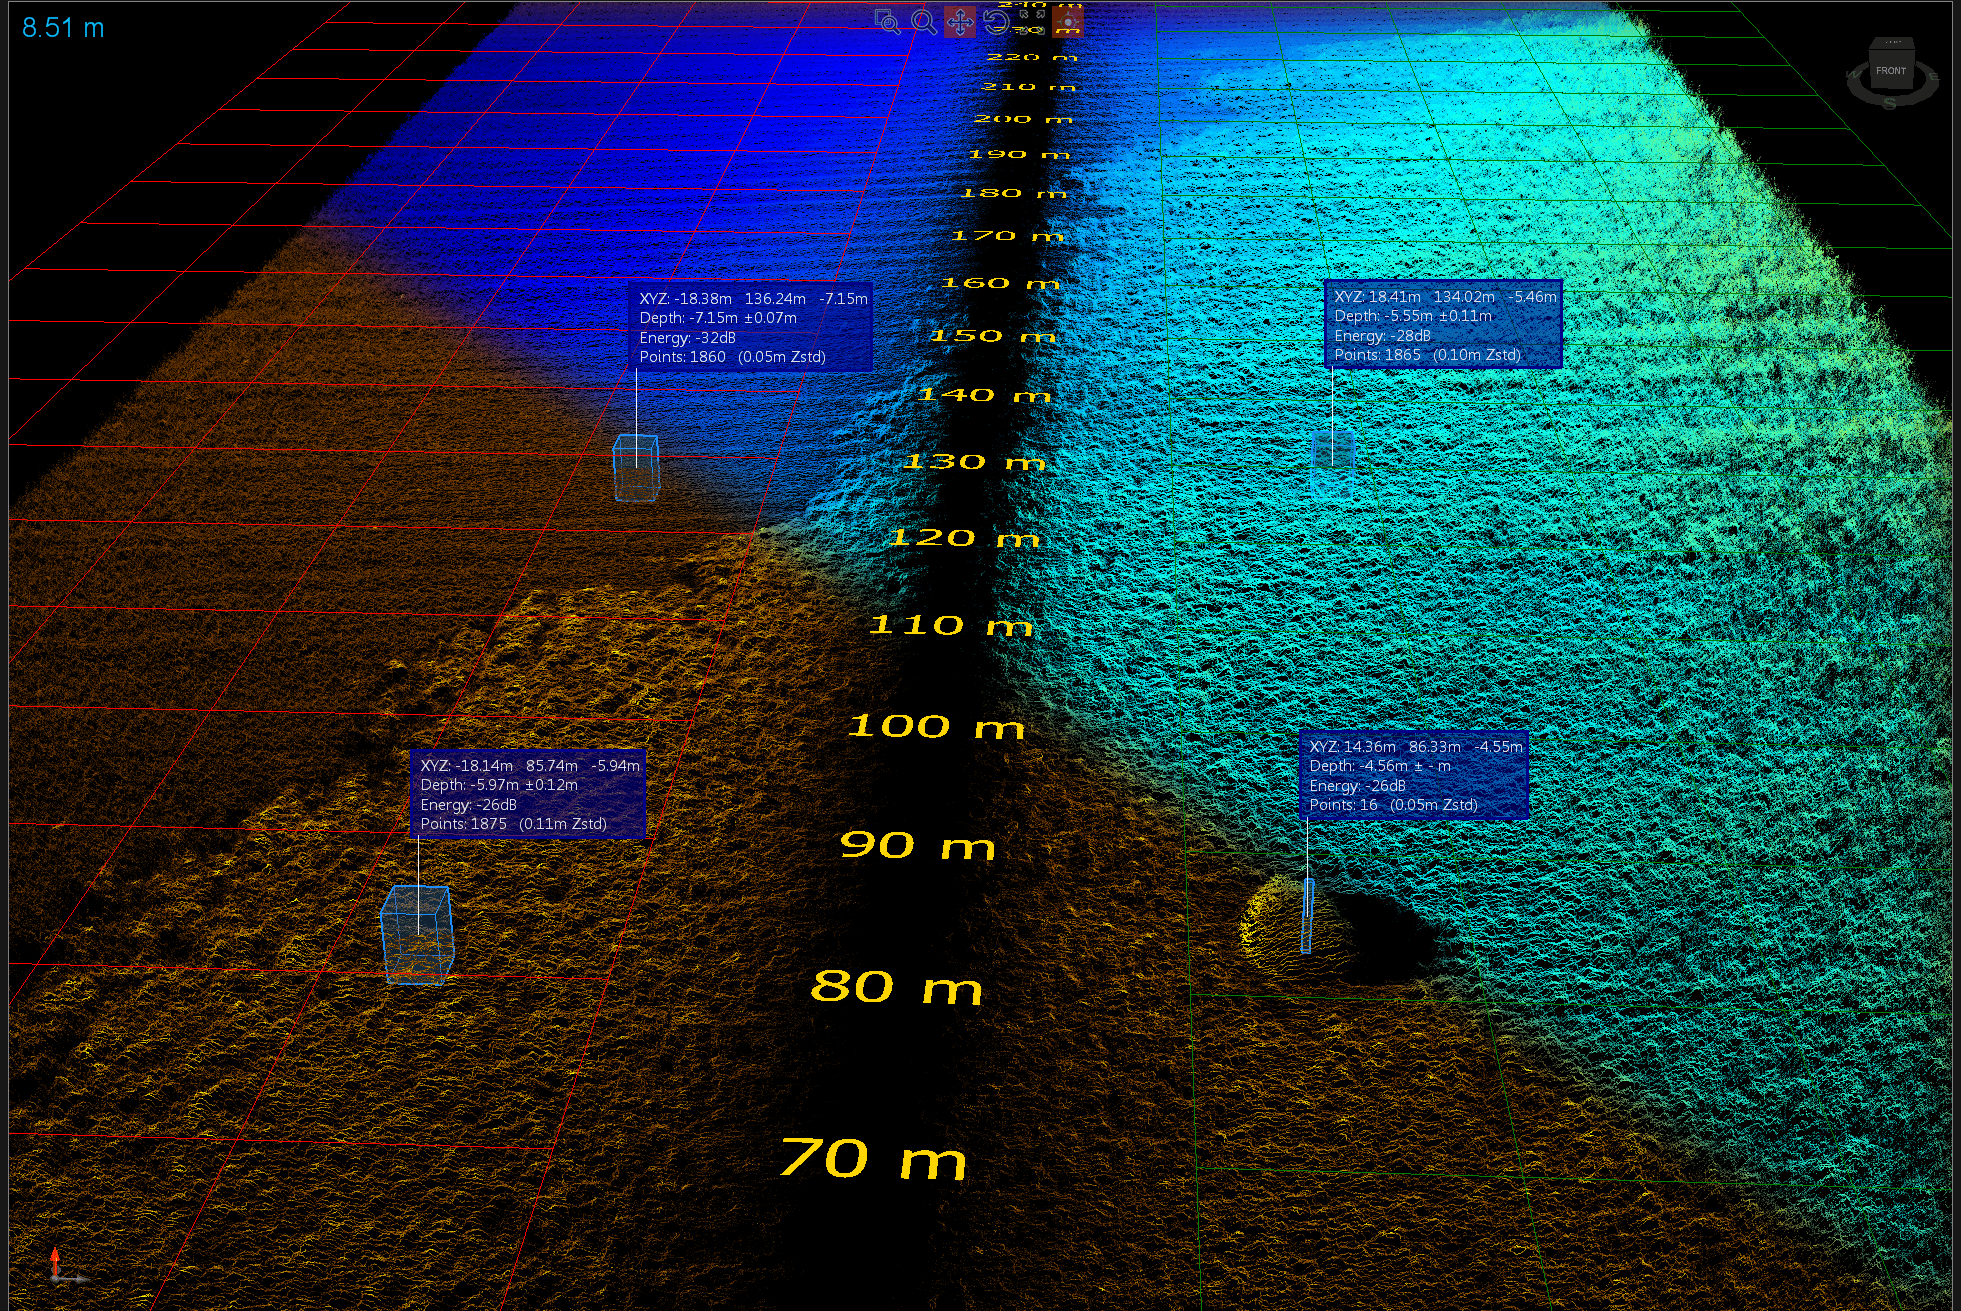
In the image to the right of this text, an Eel Grass bed imaged in Bazan Bay, Canada is colourized by depth (blue represents deeper targets) and by acoustic reflectivity (a brighter point indicates a stronger return). The Eel Grass may be recognized by its irregular bathymetry and its reflectivity fluctuations. Depth callouts on both displays show the height of the Eel Grass relative to the seafloor depth as well as the difference in depth variability for both the Eel Grass measurements and the sandy seafloor. A large rock is also labeled with its minimum depth.
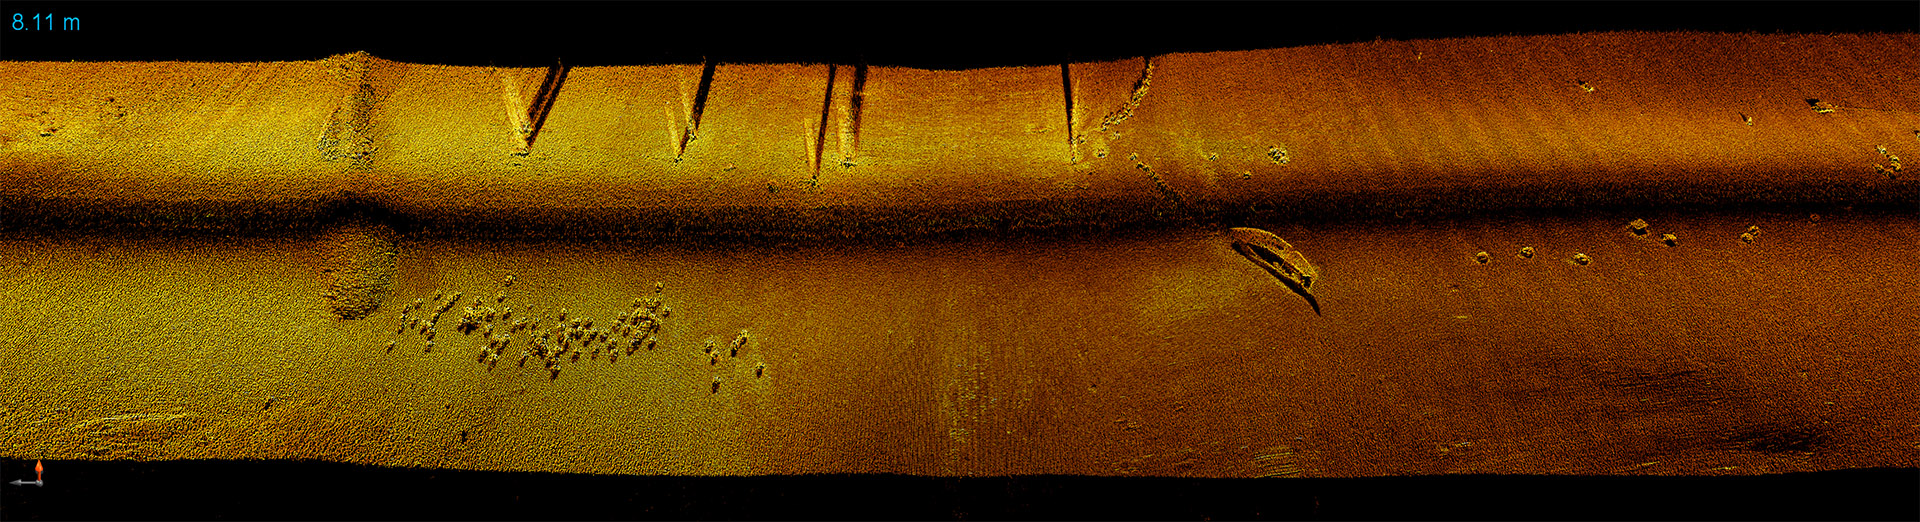
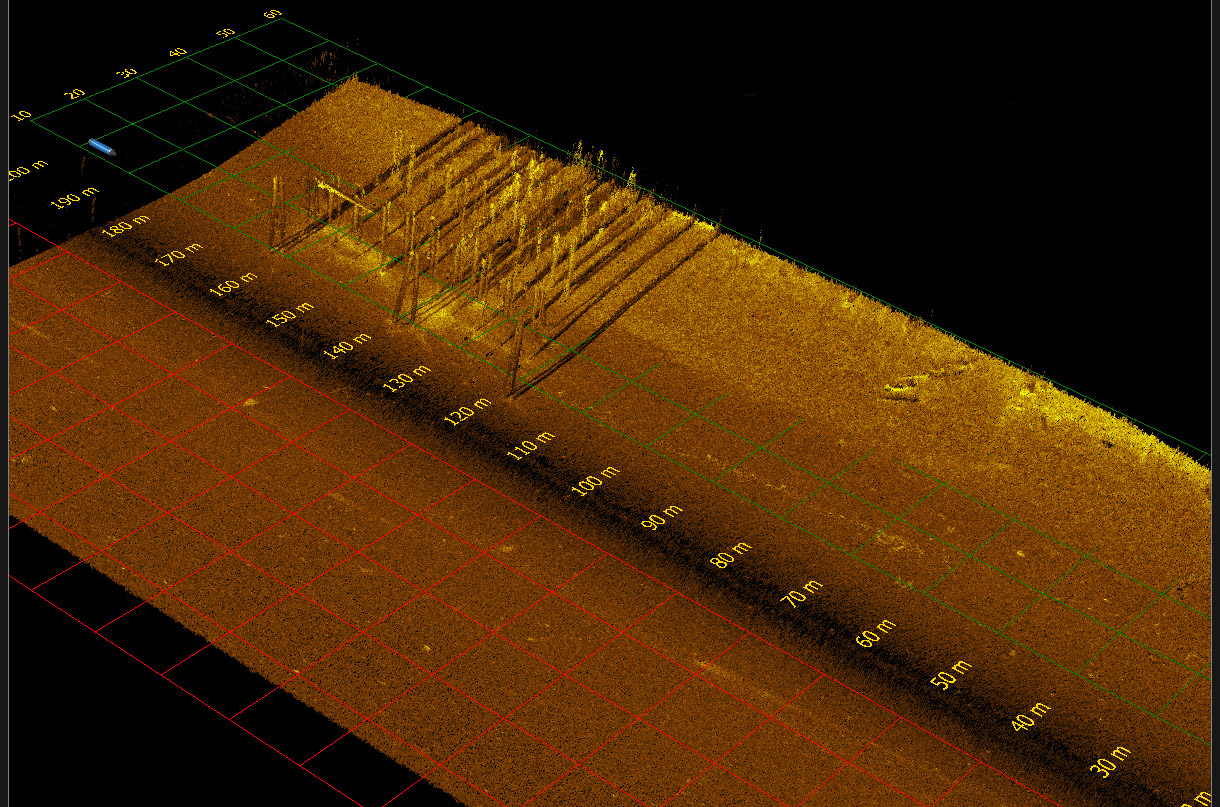
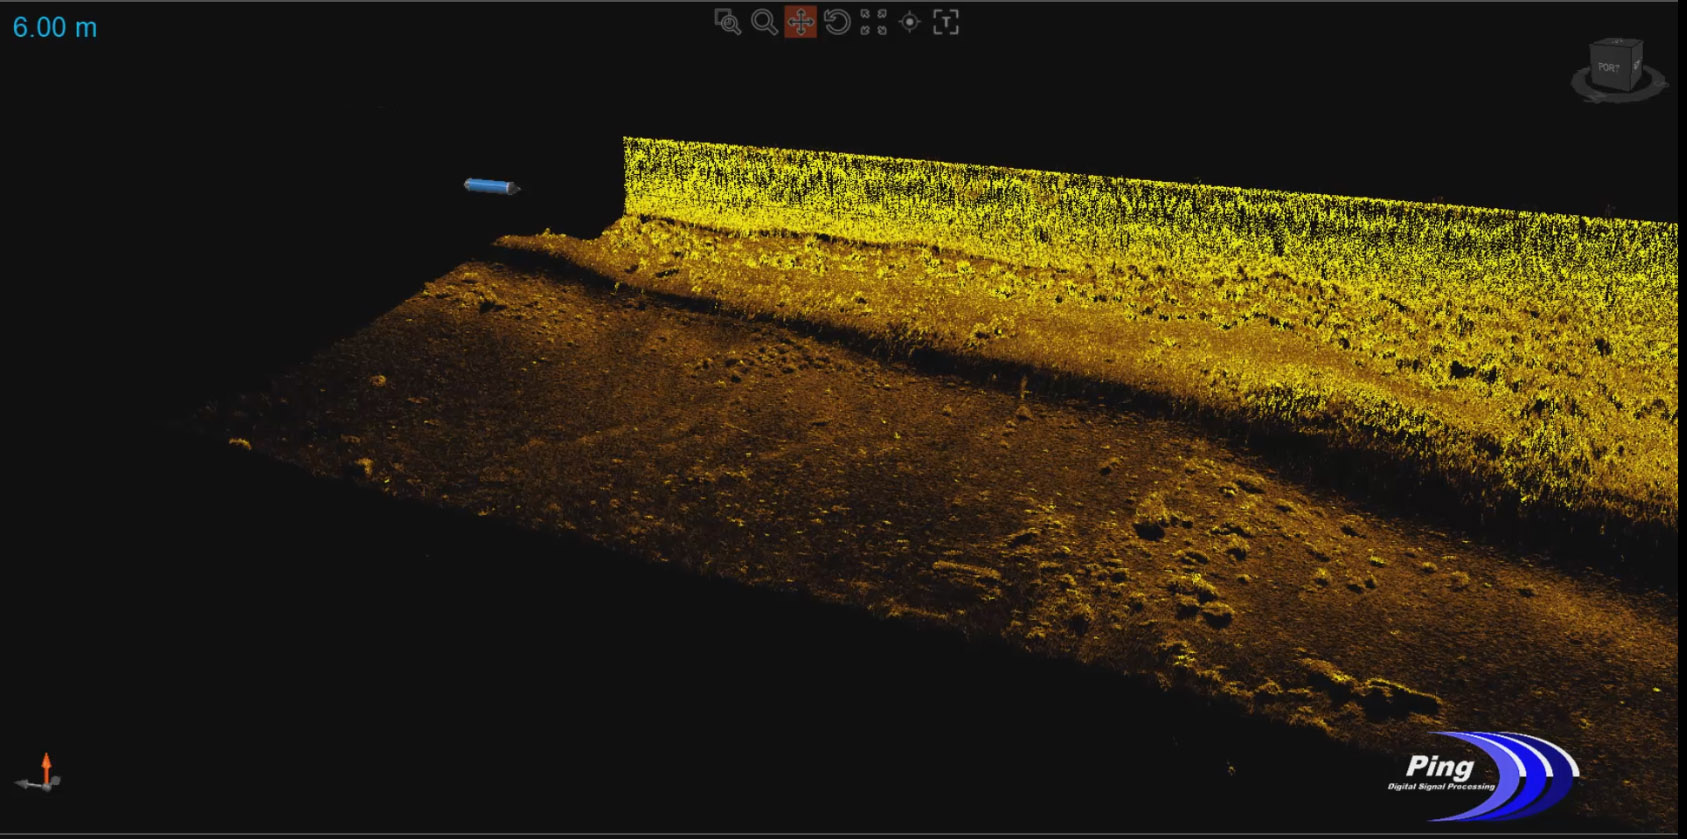
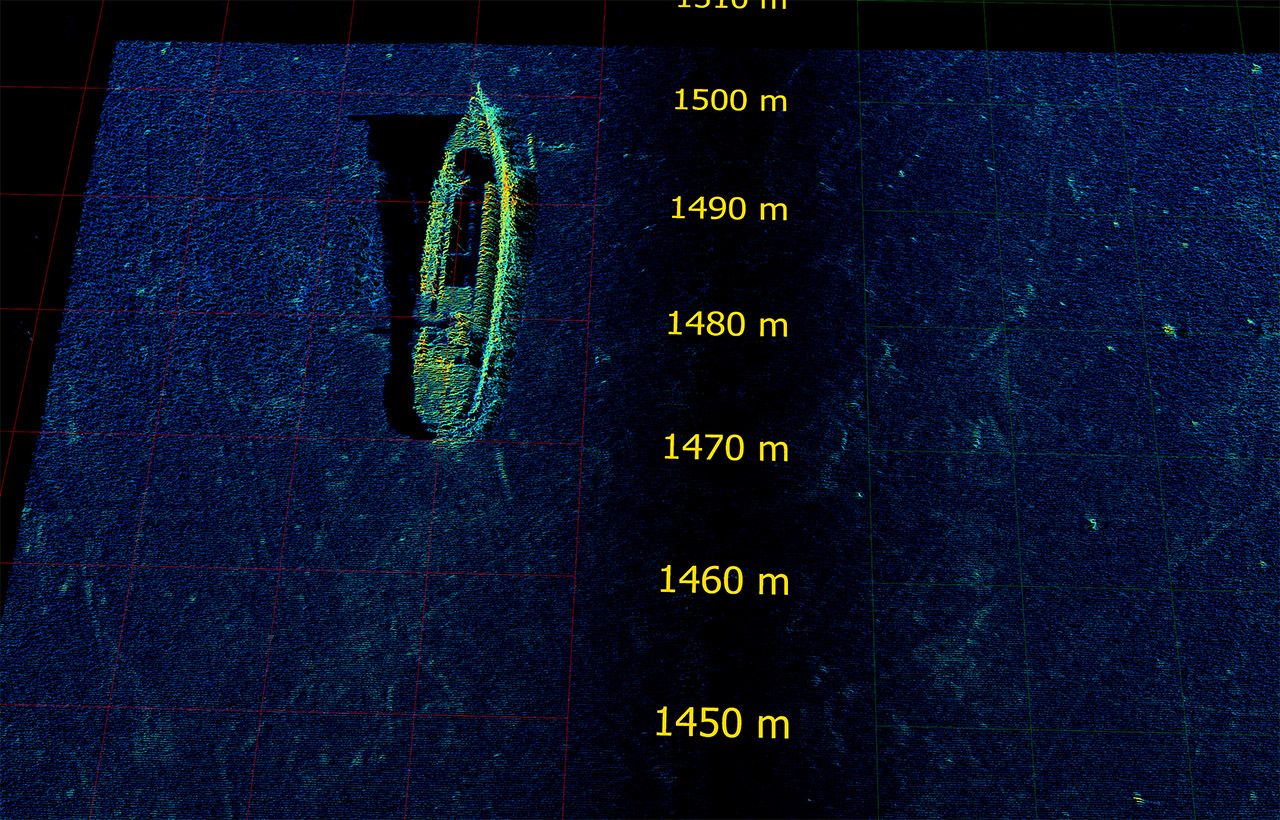
The animation at the bottom of this page shows a section of the Molasses Reef near Key Largo, Fla. The data is displayed as collected in real time and is shown colourized by both backscatter amplitude and by depth (bathymetry). The backscatter amplitude display is a geometrically correct 3D view and indicates fine structure. The high resolution bathymetry display clearly delineates the reef. Both images cover a swath width of approximately 15 times the sonar altitude.
Fisheries Security and Benthic Imaging

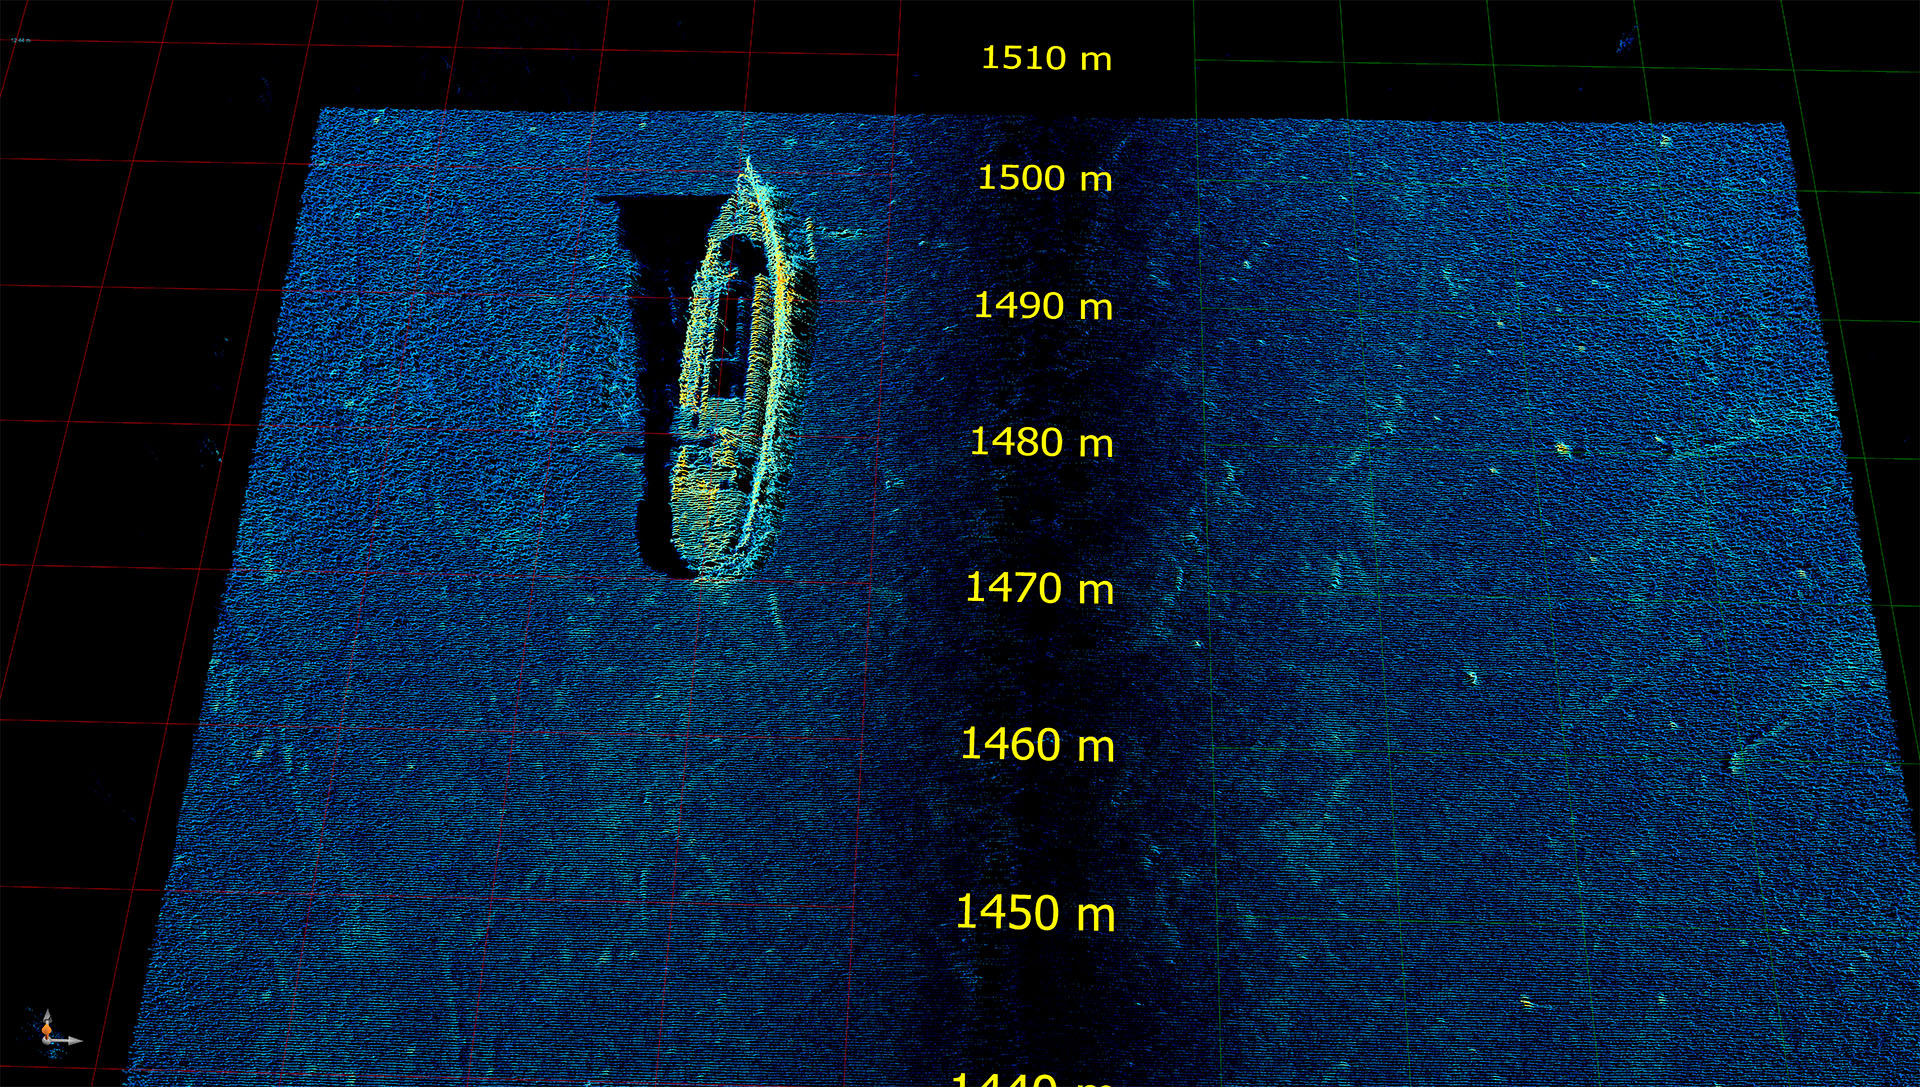
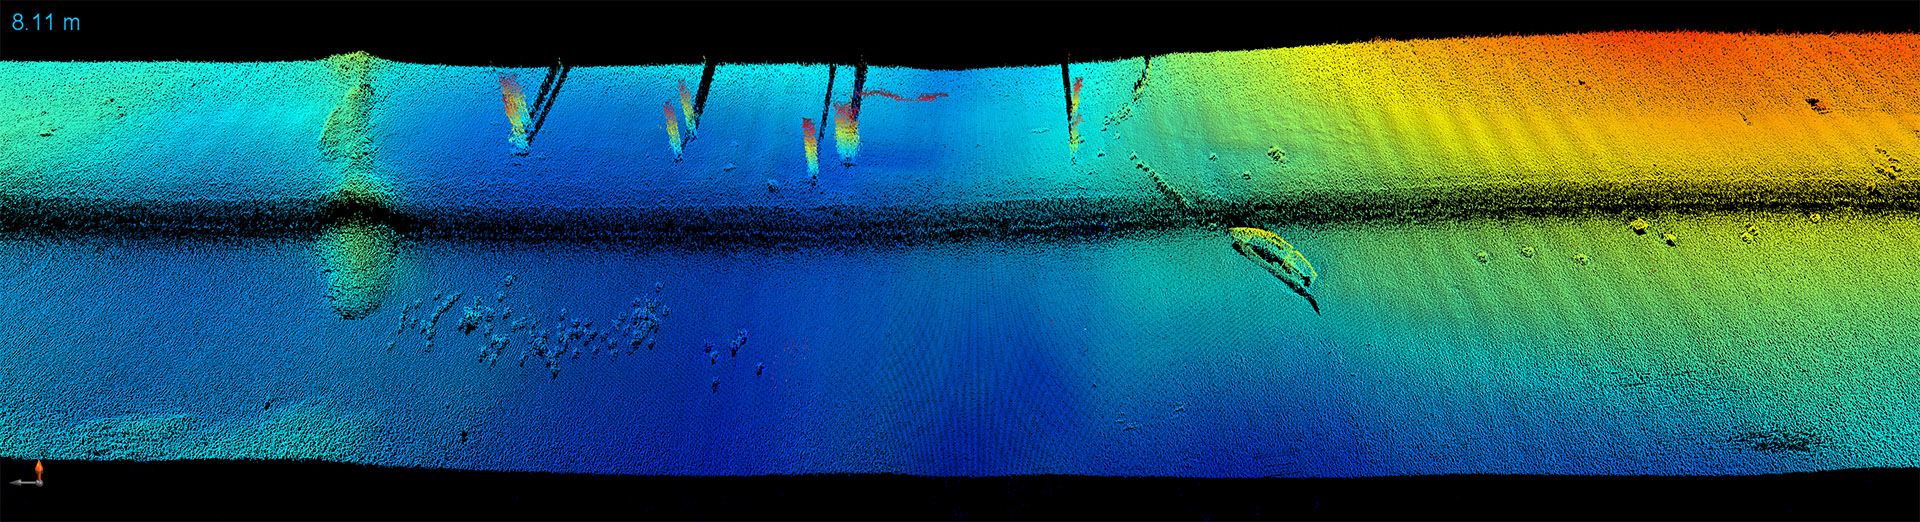
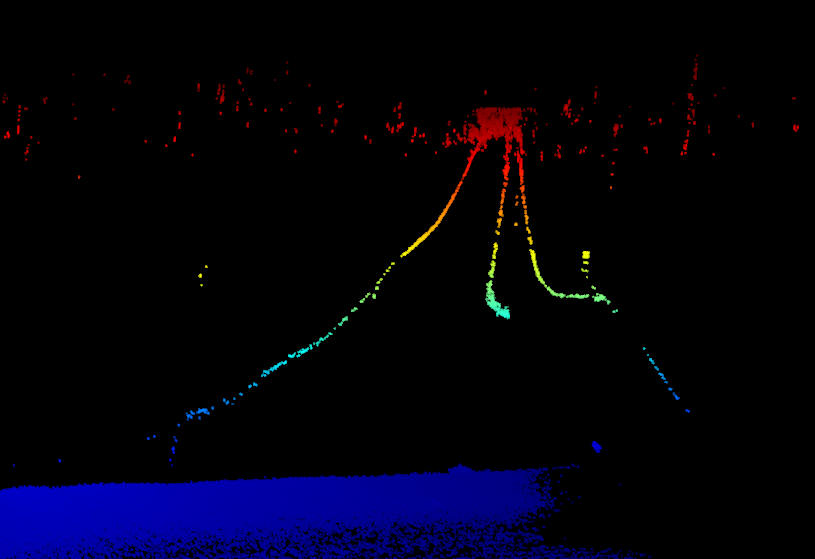
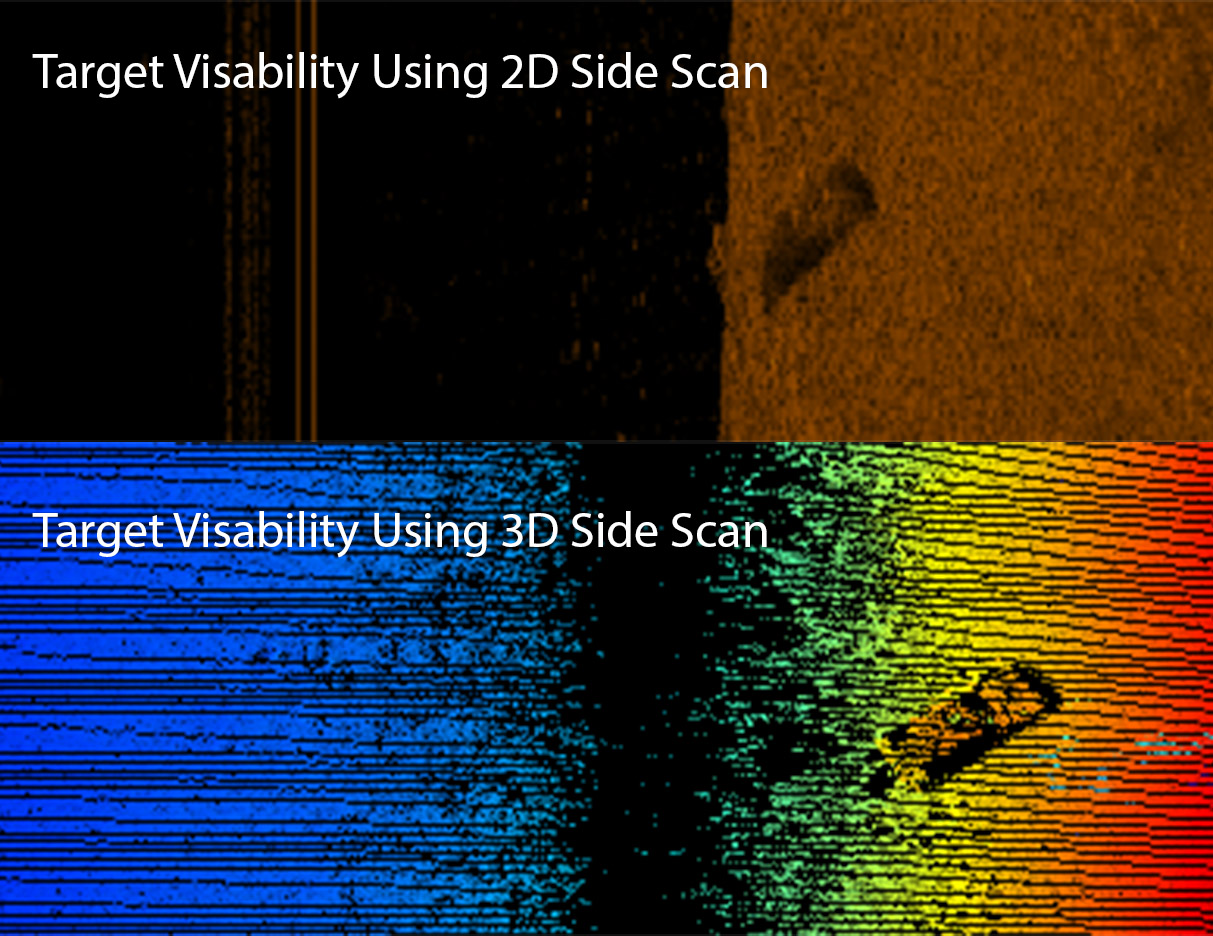
This animation shows a gillnet and schools of fish colourized by both intensity and depth. The net has an opening near the centre, and the anchor line at the near end and along the bottom of the net is also evident in the backscatter intensity. The schools of fish are weak water-column targets that do not cast shadows and are therefore not easily visible with 2D Side Scan, but are immediately apparent in 3D Side Scan.